
About Me
I am a Senior Machine Learning Scientist with Maxar Technologies on the Insights and Analytics team. My primary responsibilities include developing new modeling approaches for object detection and semantic segmentation tasks, incorporating foundational imagery models to improve our workflows, and turning research tools into production-grade customer solutions.
Previously, I received my PhD from Columbia University. My research focused on energy system modeling in a variety of settings, including Ethiopia and New York State. I leveraged a combination of methods to best understand the engineering implications of energy systems in transition: For projects set in Ethiopia, I used geospatial analysis, computer vision, and deep learning strategies to identify the location of irrigated cropland and attendant energy requirements. For work based in New York, I built optimization models to characterize grid systems to evaluate cost-effective strategies for integrating renewable generation and achieving climate goals.
Building on an internship I completed at Descartes Labs, I also explored the benefits of pairing radar and optical satellite imagery. My work in this field included generating the novel SEN12TS dataset, a 1.5 TB public resource that combines timeseries of Sentinel-1 and Sentinel-2 imagery with land cover data; demonstrating the ability to predict vegetation strength from radar images; and developing a set of cropland classifiers in the California Central Valley.
Academic Research Projects
Irrigation mapping in Ethiopia
Using Sentinel-2 10m imagery, labeled polygons indicating the presence of irrigation, and deep learning methods, we have built an irrigation mapping classifier for the Ethiopian highlands, an area consisting of Tigray and Amhara regions. In developing this classifier, we explored various training strategies and neural network architectures to ensure model transferability. Our predictions indicate that irrigated area has declined by 40% from 2020 to 2021 in Tigray and Amhara following the eruption of civil conflict in Ethiopia in late 2020.
 Figure: Bitemporal irrigation map for Amhara. The 2020 irrigation map is presented in the red channel; the 2021 irrigation map is presented in both green and blue channels (yielding cyan). Example predictions around Choke Mountain displaying interannual irrigation patterns are shown in the figure inset.
Fusing Sentinel-1 and Sentinel-2 imagery for deep learning
Combining radar and optical imagery allows researchers to extract otherwise hidden information and take advantage of the unique characteristics of both types of sensed data. To this end, we have developed the SEN12TS dataset, a public resource that includes radiometric terrain corrected (RTC) synthetic aperture radar (SAR) backscatter measurements; interferometric synthetic aperture radar (InSAR) coherence and phase layers; local incidence angle and ground slope values; multispectral optical imagery; and decameter-resolution land cover data. The SEN12TS dataset consists of 46,400 images over 31,398 unique spatial extents for a total size of 1.53 TB. We also demonstrate two use cases for the SEN12TS dataset, translating radar imagery into vegetation indices and classifying cropland in California.
 Figure: Column A presents SAR backscatter with the vh layer in both red and green bands and the vv layer in the blue band; Column B presents single band images containing InSAR coherence; Column C presents generated EVI predictions; Column D presents Sentinel 2-derived EVI measurements; Column E presents true-color RGB images of the landscapes. Rows 1-4 present images collected around September 16, 2020; August 14, 2020; April 1, 2020; and October 18, 2020, respectively. All image settings are in California.
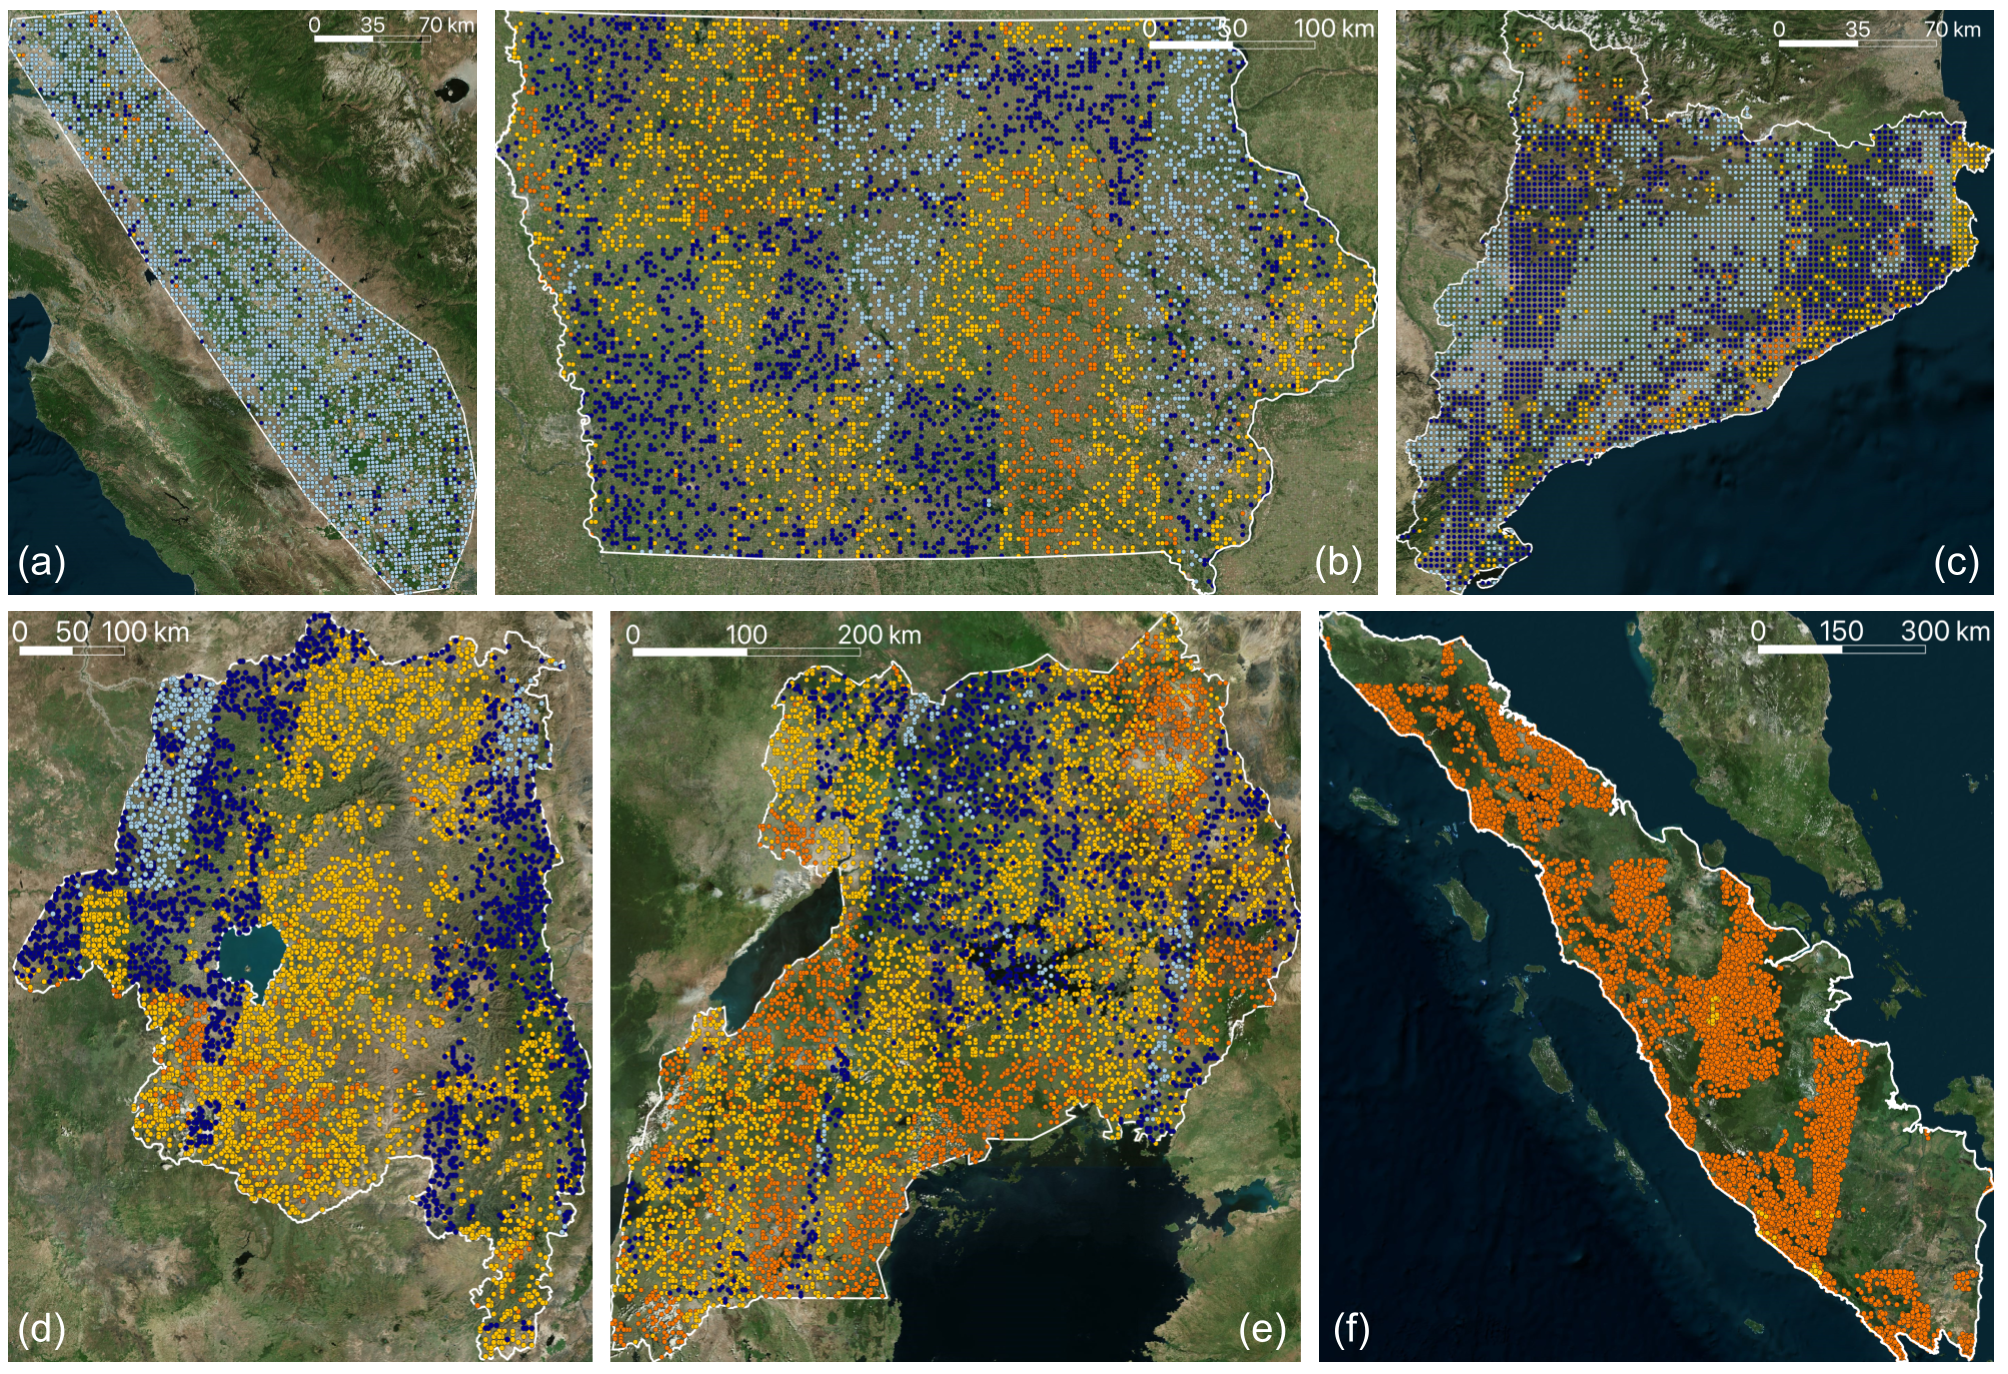 Figure: Locations of saved imagery in the SEN12TS dataset: (a) California, (b) Iowa, (c) Catalonia, (d) Ethiopia, (e) Uganda, and (f) Sumatra. Dot color indicates the number of images available for a set spatial extent.
Assessing energy sector decarbonization pathways for New York State
New York State has recently enacted legislation commiting it to a series of climate goals stretching to 2050. Using linear programming and a high-fidelity characterization of the New York State electricity grid, we simulate decarbonization scenarios containing various amounts of heating and vehicle electrification and low-carbon electricity. We find that prioritizing deep heating and vehicle electrification allows New York State to meet its climate goals while while avoiding substantial cost increases, and that 100% low-carbon electricity mandates cause electricity prices to skyrocket.
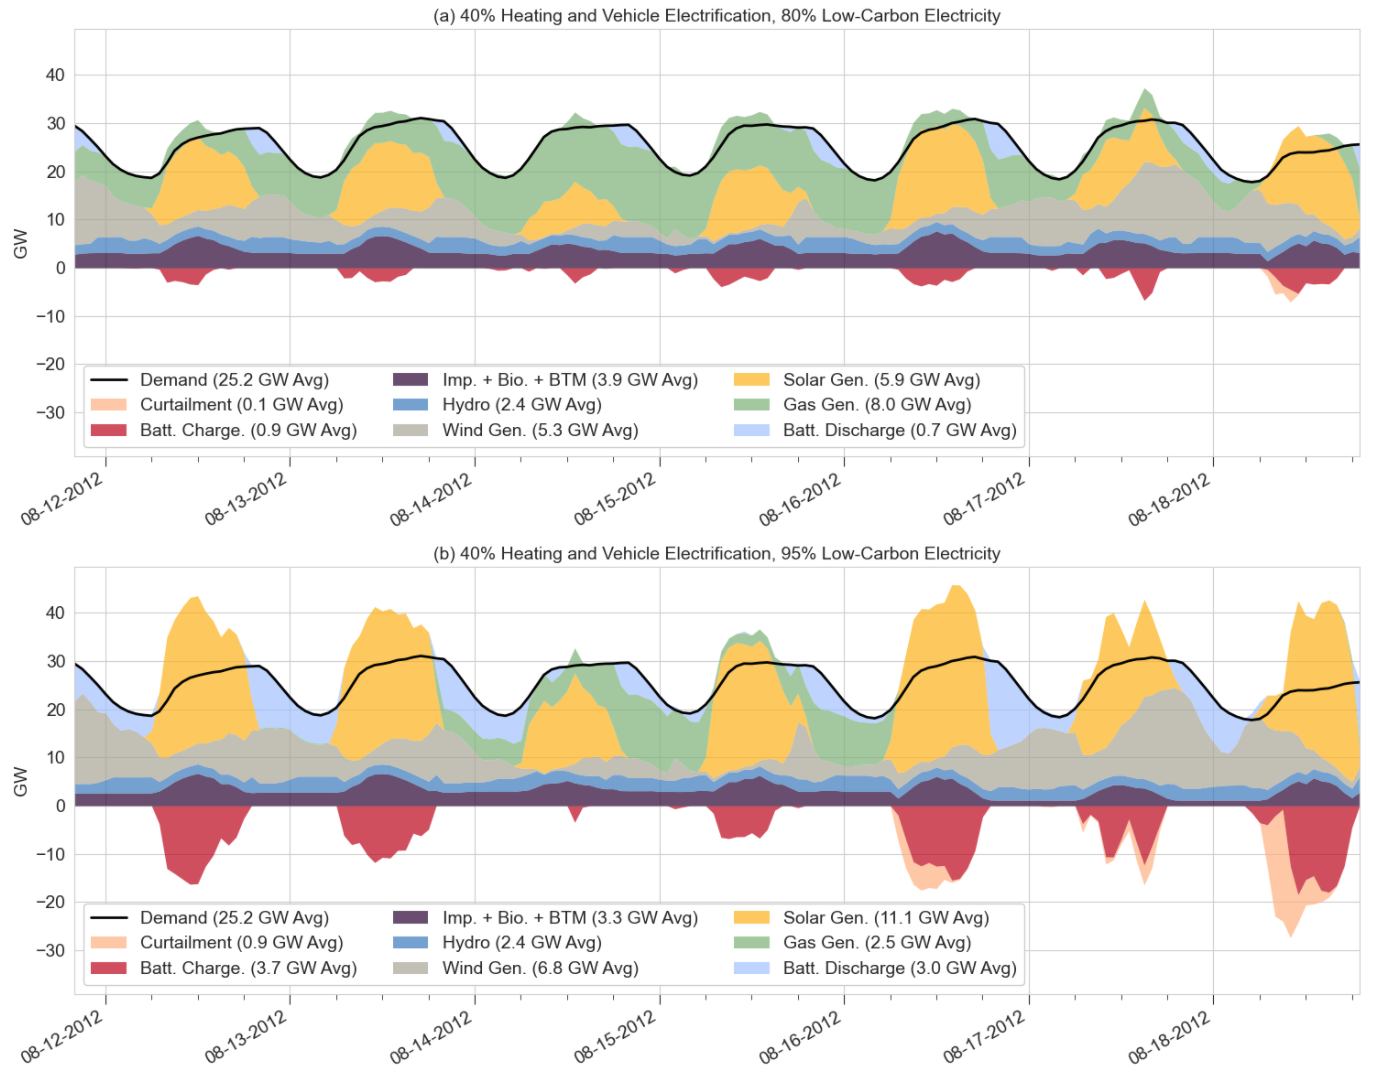 Figure: Electricity generation and demand for New York State during a representative summer week with 40% heating and vehicle electrification. (a) presents results for 80% low-carbon electricity; (b) presents results for 95% low-carbon electricity.
Education
Ph.D. in Mechanical Engineering, Columbia University, 2022
M.S. in Mechanical Engineering, Columbia University, 2018
B.S. in Mechanical Engineering, Duke University, 2016